A government may have thousands of projects operating simultaneously across roads, water, sanitation, housing, transport, healthcare, education, energy and urban infrastructure. Each project may have its own department, budget, contractor, timeline and reporting structure. The difficulty is not always the absence of information. Often, the information exists in many different places, making it difficult for decision-makers and citizens to see the complete picture. A Government Delivery Dashboard can address this problem by creating a common visual system for monitoring public projects and services.
The basic idea is to give government a continuously updated operational view of what it is trying to deliver. Instead of waiting for periodic reports, senior administrators could see the status of major projects through a single dashboard. A road project could show its approved cost, expenditure, physical progress, contractor, planned completion date and current status. A water project could display the number of households targeted, connections completed, construction progress and unresolved obstacles. A hospital project could show construction progress, equipment procurement and expected commissioning date.
India already has several examples of government dashboards. The National Informatics Centre’s DARPAN platform is designed to consolidate information from multiple sources and provide administrations with analytical views of departmental activities and project monitoring. The Ministry of Statistics and Programme Implementation also operates a public infrastructure and project monitoring dashboard containing information such as project counts, approved costs, revised costs and expenditure. These examples demonstrate that dashboard-based monitoring is already part of India’s digital governance infrastructure.
The proposed innovation is to make the dashboard a core operating mechanism rather than simply another reporting website. Every significant public project could have a standardized digital record. The record would begin when the project is approved and continue through planning, procurement, construction, commissioning and eventual completion. Each stage would create information that can be connected to the same project identity.
This would make it possible to distinguish financial progress from physical progress. A project that has spent 80 percent of its budget but completed only 50 percent of its physical work would require attention. Conversely, a project that has completed most of its physical work but is waiting for a final administrative approval would present a different type of problem. A dashboard can bring these differences into view.
Time would become another important dimension. Every project should have an original schedule and a current schedule. When a project falls behind, the dashboard should show the delay rather than allowing the project to continue appearing simply as “ongoing.” Administrators could then examine the reason for the delay. Land acquisition, environmental clearance, procurement, contractor performance, utility shifting, design changes and funding constraints may require completely different interventions.
A good dashboard would therefore not merely display numbers. It would connect numbers to decisions. When a project crosses a predetermined delay threshold, the responsible authority could receive an alert. If expenditure rises substantially without corresponding physical progress, the project could be flagged for review. If several projects encounter the same type of obstacle, administrators could identify a systemic problem rather than treating each project separately.
The system could operate at multiple administrative levels. A field engineer might see detailed information about individual worksites. A municipal commissioner could see projects across the municipality. A district administrator could see projects across departments within the district. State-level administrators could see the larger portfolio. National authorities could view aggregated information across states and sectors.
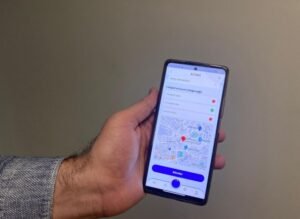
Citizens could receive a simplified public version. They would not necessarily need access to every internal government document. They could see what projects are planned in their locality, how much public money has been allocated, what stage each project has reached and when completion is expected. Where appropriate, photographs and geographic maps could provide additional context.
This creates an important connection between public expenditure and public experience. A budget announcement is an intention. A sanctioned project is an administrative commitment. Construction is implementation. Completion is delivery. A Government Delivery Dashboard allows citizens and administrators to follow this entire chain.
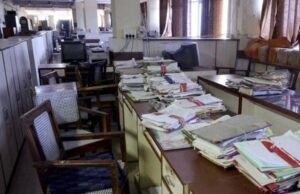
The system could also improve institutional memory. Public projects frequently continue through changes in government, ministers, senior officials, contractors and administrative priorities. A standardized project record ensures that the history of a project does not depend entirely on individual officials. Decisions, revisions, delays, expenditure and milestones remain connected to the project itself.
One of the most useful features could be a “problem layer.” Instead of merely showing that a project is delayed, the dashboard could record why. A delay caused by land acquisition should not appear identical to a delay caused by contractor non-performance. Once the reasons are structured, government can identify patterns across hundreds or thousands of projects.
For example, if numerous road projects are delayed because utility lines have not been shifted, the problem may not be with individual road contractors. It may indicate inadequate coordination between infrastructure agencies. A dashboard capable of revealing such patterns could help government redesign processes rather than repeatedly solving the same problem.
Artificial intelligence could eventually support this system by detecting unusual patterns in project data. Algorithms could identify projects whose expenditure, timelines or physical progress differ significantly from expected patterns. They could flag projects requiring human review. However, the final administrative decision should remain with authorized officials, with the underlying data available for verification.
Public dashboards would also need safeguards against misleading interpretations. A single number rarely explains an entire project. A project can legitimately experience delays because of circumstances outside the original plan. Therefore, dashboards should provide context, including revised timelines, documented reasons for changes and the distinction between planned and actual expenditure.
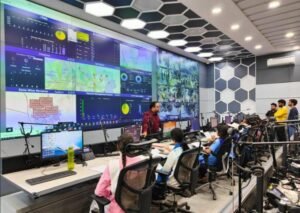
Data quality would be equally important. A visually impressive dashboard can create a false impression of modern governance if the underlying information is outdated or manually maintained without adequate verification. Research on smart-city control rooms in India, including work examining Kochi, has highlighted the practical difficulty of integrating multiple data systems and maintaining genuinely real-time information. The lesson is important: the dashboard is only as reliable as the institutional processes feeding it.
The system should therefore establish clear data ownership. Every department should know who is responsible for updating project information, how frequently updates are required and what evidence supports a reported milestone. Automated data feeds should be used where possible, while manual entries should carry timestamps and responsible-user information.
Over time, the Government Delivery Dashboard could evolve beyond project monitoring into a broader government operating system. It could connect budgets, procurement, infrastructure assets, citizen complaints, field inspections, contractors, outcomes and maintenance records. A road project would not simply disappear from the system when construction ends. Its maintenance history could continue as part of the same asset record.
That creates a fundamental shift in governance. Government stops viewing projects as isolated files and begins viewing them as continuously managed public assets and services.
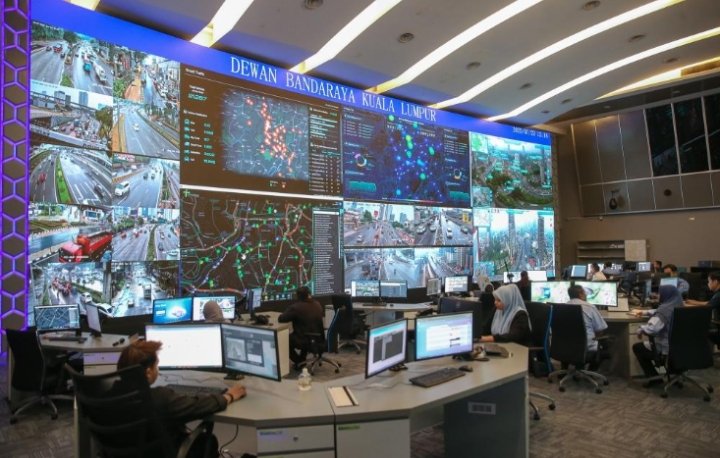
The objective is not to create a giant screen filled with charts. The objective is to make government delivery observable, measurable and actionable. When decision-makers can see what is happening, where delays are occurring, why they are occurring and which interventions are required, administrative attention can move faster.
A Government Delivery Dashboard therefore represents more than digital visualization. It is an institutional mechanism for turning government promises into trackable commitments and public expenditure into visible delivery.